
See how one agent conversation's context evolves, prompt by prompt: tokens, cache reuse, and cost — for Claude Code, Codex, and GitHub Copilot.
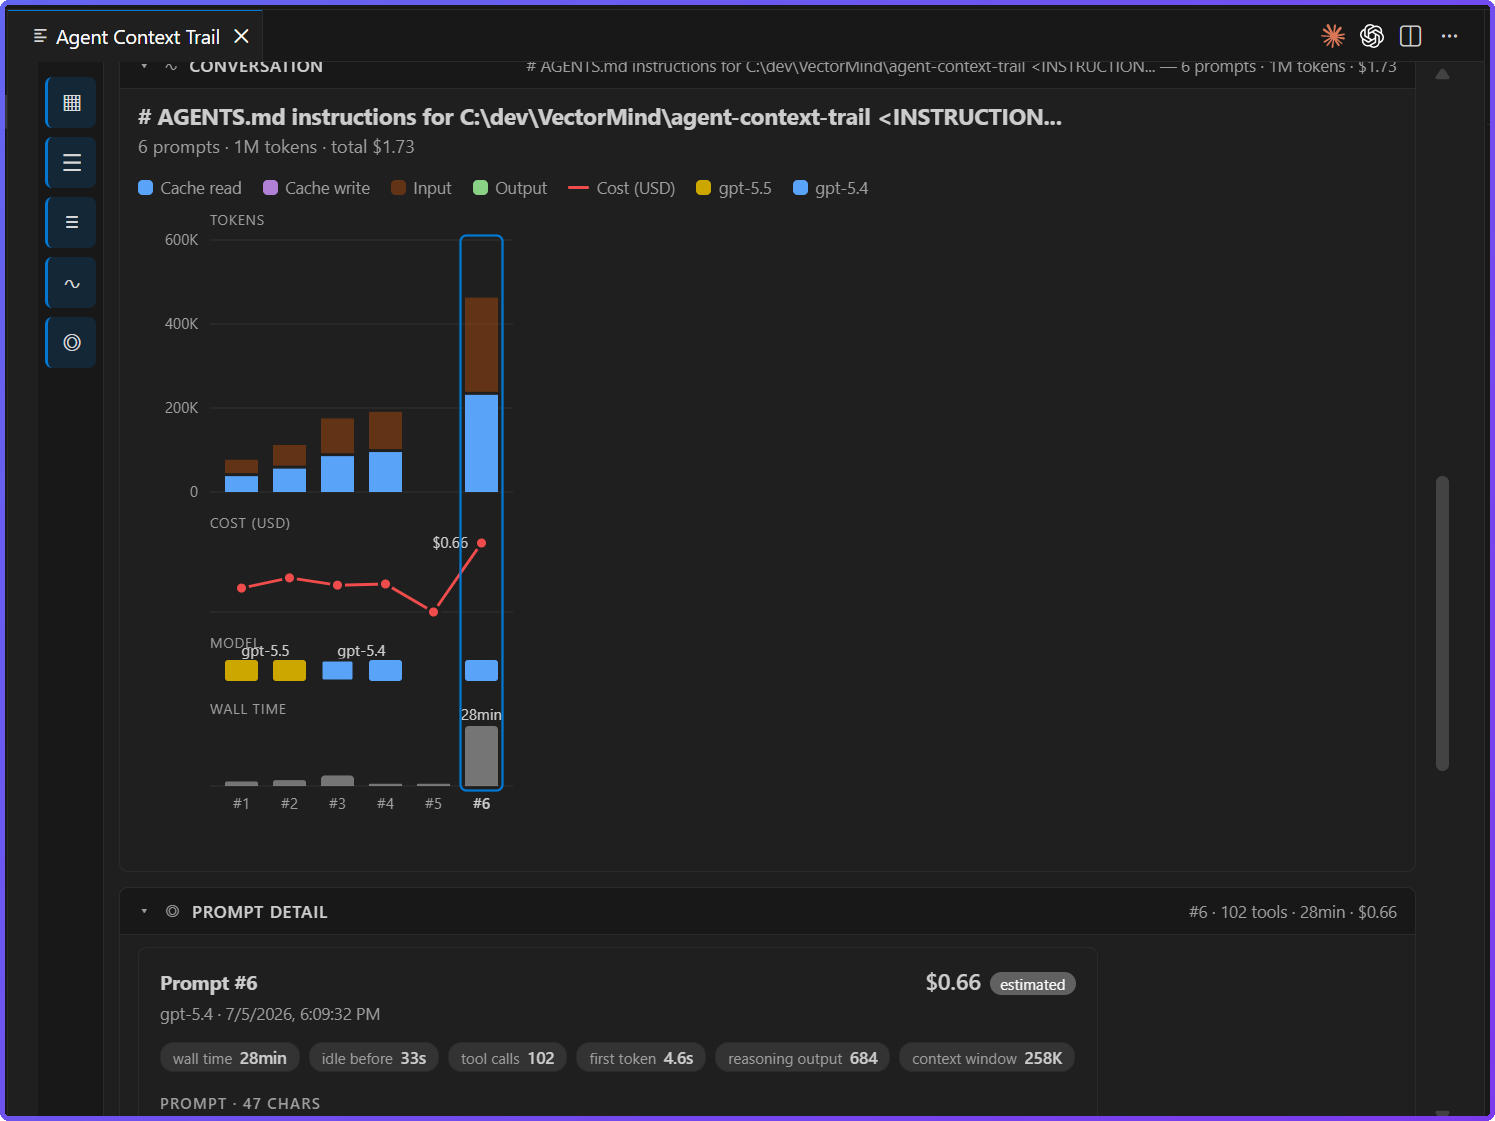
Your coding agent reads far more than you type. Every prompt re-sends the conversation context, caches parts of it, and burns tokens you never see. Agent Context Trail reads the session files your agent CLIs already write on your machine and turns them into a readable trail: what each prompt actually cost, how much context it carried, and how much the cache saved.
- Status bar cost — the last request's cost and the conversation's running total, in USD, always visible. Click it to open the panel.
- Conversation panel — one scrollable page, opened on demand (no permanent
sidebar icon):
- per-conversation stacked token bars showing each conversation's token composition at a glance;
- a sortable conversations table for the current workspace, grouped by provider, with request count, first/last message, total tokens, and cost;
- a thread chart with one bar per request — token composition and cost, scaled to the conversation itself;
- a request detail card: model, input / output / cache-read / cache-write tokens, tool calls with per-call latency, prompt text, wall time, and more when the provider exposes it.
- Cache reuse made visible — cache reads and writes are first-class everywhere, so you can see when a long conversation is paying off and when a cache break made it expensive again.
- Honest numbers — every cost is labeled
provider-reportedorestimated; fields a provider does not expose are shown as unavailable, never as a fake zero.
| Provider | Depth |
|---|---|
| Claude Code | Full: tokens, cache read/write, cost, tool calls, titles, request detail |
| Codex | Best-effort from local session data, including Codex-native signals |
| GitHub Copilot | Real tokens, model, tool calls, and estimated cost from VS Code's own chat log — no setup step (see below) |
- Install the extension and open a workspace where you use Claude Code or Codex.
- The status bar item appears automatically with the latest conversation's cost.
- Click it — or run Agent Context Trail: Open Conversation Panel from the
Command Palette (
Ctrl+Shift+P) — to explore the trail.
Other commands: Agent Context Trail: Refresh and Agent Context Trail: Show Conversation Summary (Text) (plain-text summary in the output channel).
Local-first, by contract:
- Everything is read from the local session files the agent CLIs already write. No server process, no account, no sign-in.
- No telemetry, no analytics, no upload of prompts, transcripts, or file contents — under any configuration.
Copilot's numbers come from the same chatSessions log VS Code's own Chat
view already writes for its history UI — nothing to enable, no command to
run, no export step.
-
What's shown: real prompts, resolved model, input/output tokens, tool calls, timings, and an
estimatedUSD cost, plus Copilot's own real premium-request credit figure (copilotCredits) shown alongside the cost estimate as its own signal — never merged with it. When the session log includes model capacity, the latest request's input and context-window size also feed Current Context Status. -
What's not shown from the zero-config log, and why: per-LLM-call and cache token counts. Copilot's
chatSessionslog records only request-level usage, so the Prompt timeline can't show per-call context from it — a real gap in that source, not something this extension chose to hide. See the opt-in enrichment below for how to fill it. -
Optional per-call enrichment (opt-in OpenTelemetry): Copilot Chat can export one span per LLM call over OpenTelemetry. If you turn that on and point it at a loopback endpoint, Agent Context Trail receives it locally and fills the Prompt timeline with real per-call context — input, cache-read, output, and reasoning tokens. Add these to your VS Code settings (the extension never writes them for you) and pick any free port:
"github.copilot.chat.otel.enabled": true,
"github.copilot.chat.otel.exporterType": "otlp-http",
"github.copilot.chat.otel.otlpEndpoint": "http://127.0.0.1:9876",
"github.copilot.chat.otel.captureContent": false
The extension binds that loopback port, keeps only allowlisted usage and correlation fields (never prompts, code, tool payloads, or repository metadata — those are dropped before anything is written, even if content capture is left on), and stores them as its own daily JSONL under the extension's storage, pruned to the current plus two preceding calendar months. This local usage history is the extension's own Copilot OpenTelemetry store; provider logs are read directly and never copied. When the Copilot tab is open, the panel's status footer shows the activation state and how much local usage history is on disk, as a troubleshooting aid. Cache-write tokens stay unavailable because Copilot does not emit them on any surface.
-
Cost is
estimated, the same bring-your-own-token convention used for Claude and Codex: GitHub does not publish a Copilot token-to-USD rate, so this extension estimates against the resolved underlying model's public API rate where known, falling back to a generic current-generation rate for models it doesn't recognize (including internal Copilot routing codenames) rather than reporting no cost at all.
When a provider reports cost directly, that value is used and labeled
provider-reported. Otherwise cost is estimated from token counts against a
hand-maintained rate table that cites the official pricing page and the date
it was last checked. Subscription-billed providers still get an estimate: the
dollar-equivalent of the same tokens at the vendor's public API rates, so
opaque rate-limit plans become legible too.
Build, packaging, and contribution notes live in DEVELOPMENT.md.